Recruiting analytics for data-driven hiring.

Recruiting Analytics for Data-Driven Hiring

Recruiting analytics, or recruitment analytics, is data science for the recruiting industry. (Otherwise known as reporting.) It enables your hiring team to measure recruiting efforts and adjust strategy based on data rather than instinct or experience alone. This guide offers an introduction to recruiting performance analytics, the platforms available, and correct techniques for getting accurate, actionable insights into your recruiting processes. 

RECRUITING ANALYTICS BASICS

What Is Recruiting Analytics?

Professionals in the recruiting industry, as with professionals in other industries before them, now have big data at their fingertips. That’s good news for anyone working in recruitment. But what exactly is recruiting analytics again?

RECRUITING ANALYTICS BASICS / 01

The simple answer

Big data in the recruiting industry. 

Hiring teams can now make evidenced-based recruiting decisions rather than experience- or intuition-based decisions. They can use recruitment analytics to measure how well they’re doing and set or adjust hiring strategies accordingly. 

Hiring teams can now track which sources are sending the best talent their way, rather than guessing at it or relying on anecdotal evidence. They can diagnose and fix issues in their talent pipeline, improving overall recruiting performance and the candidate experience along with it. They can measure the impact of recruiting efforts on strategic business goals, and much more. 

RECRUITING ANALYTICS BASICS / 02

The complex answer

Recruitment analytics didn’t just appear out of the vapor, fully formed. Sure, other industries have been using analytics for years. But there’s a learning curve any time data science comes to a new industry. Data scientists have to learn how to accurately measure data in the new industry, and the industry itself has to learn how to use analytics. 

Digital drawing of a computer monitor and recruiting analytics screen.

Data science is complex, and the devil is very much in the details. Only clean data can yield accurate metrics and, subsequently, correct insights. The quality of the raw ingredients determine the quality of the final meal (i.e., GIGO, or garbage in, garbage out). Your methodology in recruiting analytics determines the value of the insights you take from it.

Another aspect of recruiting analytics is that data science only provides insights if we have data. Once a candidate applies to our job, we can gather all kinds of information on their experience in our talent funnel. What we can’t do is get the experience of candidates who didn’t apply. We can’t assess why they didn’t apply and fix any issues we have in the attraction phase of the process.

A nuanced answer is that recruiting analytics is still evolving and is only as good as the data science behind it.

What is language analytics?

Language analytics measures the impact that the language you use has on the effectiveness of your messaging. In the case of job descriptions, language analytics helps hiring teams choose titles that job seekers can find, write clear requirements that job seekers can understand, and use inclusive language that make all job seekers feel welcome to apply.

RECRUITING ANALYTICS BASICS / 03

And what is data science again?

You hear a lot of high-level talk these days about how data science is transforming industries. What you don’t hear a whole lot, though, is granular talk about the nuts and bolts of data science. Or the difference between good data science and bad data science.

Honestly, you could be forgiven for thinking that data science is a form of magic. (Reading articles about it is a lesson in vagueness.) But once you dive into data science a little deeper, you see how scientific it is. Or how scientific it needs to be for it to work well

Data science is an incredibly broad collection of activities. It includes things like A/B testing, analytics, business intelligence, and ETL (extracting, transforming, and loading data from one system to another). Also experimentation, exploratory analysis, machine learning, and metrics. It’s such a broad field that it’s hard to pin down. In fact, here’s what the University of California Berkeley School of Information writes about it:

Effective data scientists are able to identify relevant questions, collect data from a multitude of different data sources, organize the information, translate results into solutions, and communicate their findings in a way that positively affects business decisions. These skills are required in almost all industries…


– University of California Berkeley School of Information

(Check out the infographic just below that paragraph for UC Berkeley’s data science life cycle drill down.)

RECRUITING ANALYTICS BASICS / 04

Getting into recruiting analytics

That’s not exactly what you’d call a ‘narrow’ field up there. And that’s important, because hiring teams need to know what they’re getting into with recruiting analytics. It’s not just a plug-and-play situation. 

Hiring teams need to narrow a tremendous amount of data down to the important metrics. And they need to do it the correct way. That means they need either solid data science skills or a recruiting analytics platform set up and used the right way. 

Digital drawing of a recruiting professional reviewing recruiting analytics on three candidates.

Unfortunately, just signing up for any old recruiting analytics platform and plugging it in isn’t enough. Someone still needs to understand data science to measure your talent pipeline. And they need help analyzing the results so they can turn them into strategy and action.

Recruitment analytics is complicated and finicky. Done correctly, it yields tremendously valuable insights about your talent pipeline. Done incorrectly, it yields wonky insights that send you down the wrong paths. It’s vital to know what you’re doing with recruitment analytics, so you get good insights out of it.

RECRUITING ANALYTICS METRICS

What Metrics Do You Measure in Recruitment Analytics?

As in other fields, data science is becoming a competitive differentiator in recruiting. Hiring teams that measure their efforts and make strategic decisions based on hard data gain a competitive advantage. 

So, which recruitment metrics do you collect and analyze? Part of the answer is obvious: the metrics you need to make sound strategic decisions. The other part of the answer is less obvious: the metrics you can collect reliably and accurately.

RECRUITING ANALYTICS METRICS / 01

The metrics hiring teams need for good strategy

Again, recruiting analytics didn’t just appear out of nowhere, fully formed. Hiring teams have been gathering certain pieces of information about the recruiting process for years. What’s changed is that data science has made information gathering and analysis more detailed and reliable.

If you’re looking at your recruiting efforts, what do you need to make sound strategic decisions? A few key metrics? Good. A bird’s-eye view of your entire talent funnel plus ground-level metrics on individual jobs and every step of your hiring process? Much better.

A few key metrics

Do a Google search for ‘recruiting metrics,’ and you’ll find dozens. Some are easier to gather than others, and some are more meaningful than others. Also, some occur during the hiring process, some afterwards. Here’s a few of the most meaningful:

A bird’s-eye view of your talent pipeline

Digital drawing of a recruiting analytics report with a filter window open.

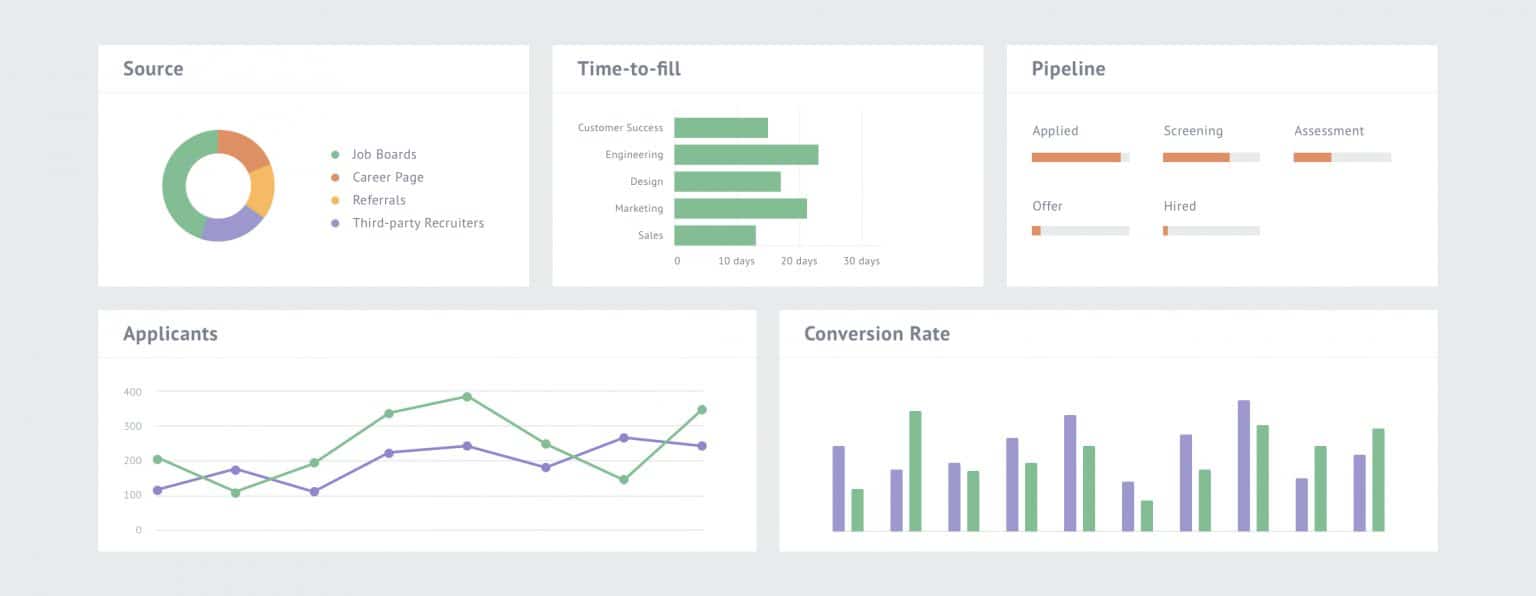
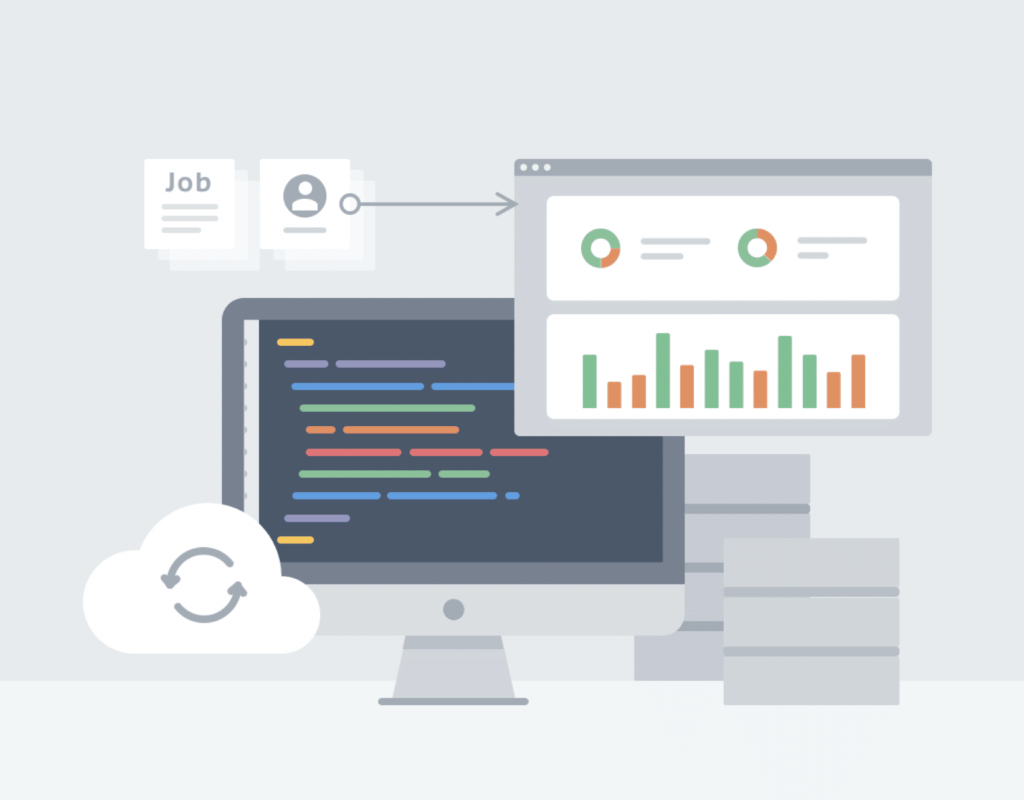
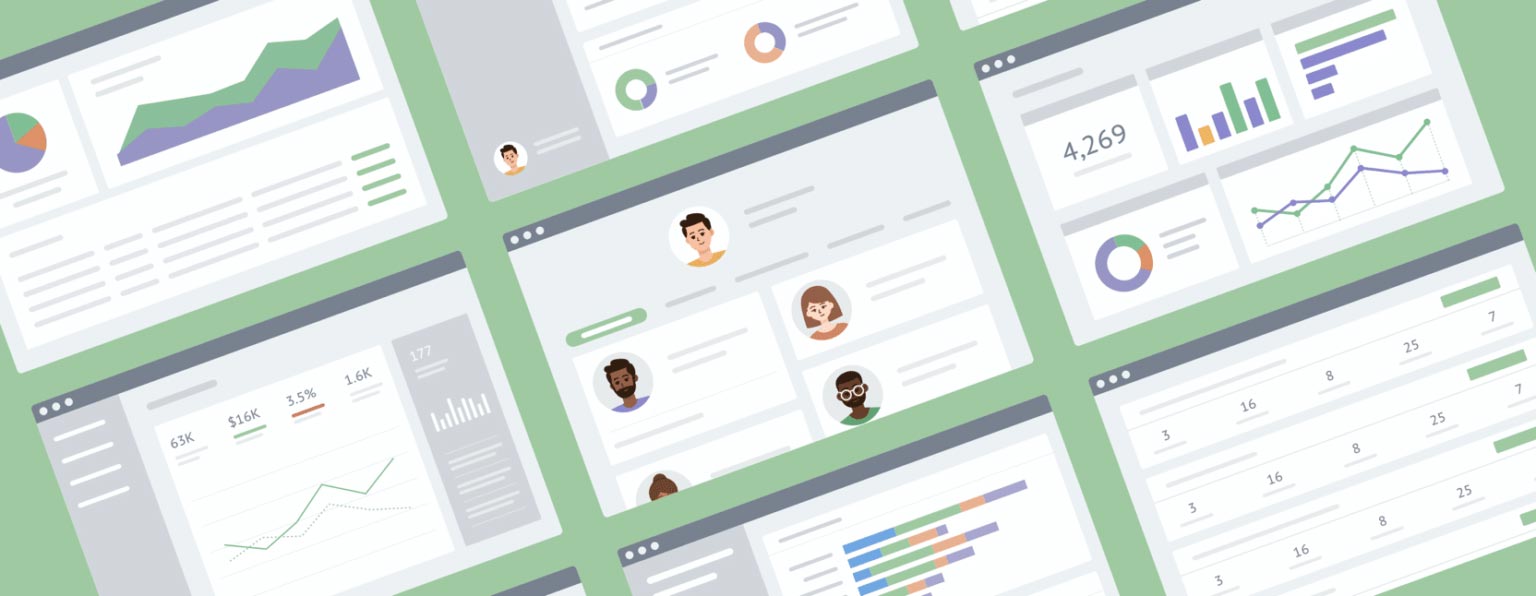
How many jobs do you have open, how long have they been open, and how many applicants have they attracted? Which sourcing platforms are getting you the most qualified candidates? How are each of your offices’ hiring efforts going?

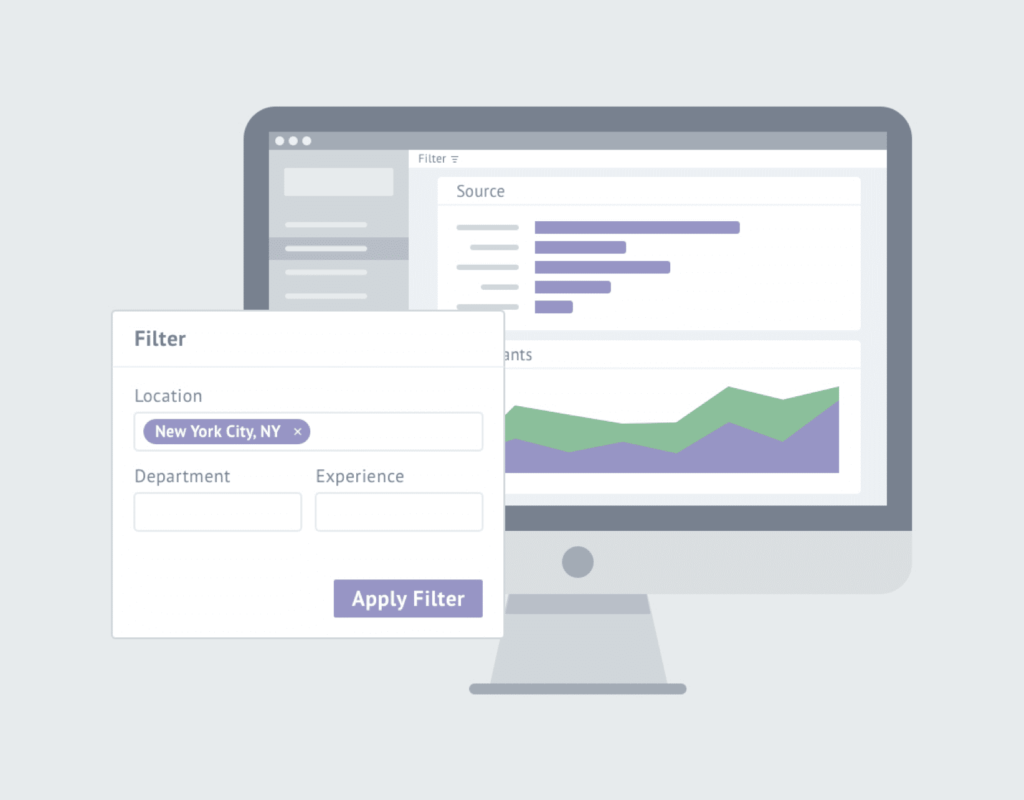
These are the kinds of questions you can answer when you have a bird’s-eye view of your talent pipeline. Your hiring team can view metrics filtered by location, department, or experience levels. You can track historical data such as total applicants versus total hires, jobs added versus jobs removed, and average time-to-fill. You can watch the trends and adjust your strategy accordingly (e.g., focus more on the successful inbound sources). 

A ground-level view of jobs and hiring steps

Is a job attracting enough qualified candidates to result in a hire? Are there enough female candidates and organic applicants to ensure fairness? (Organic candidate pools, or ones that come from job boards, are typically more diverse.)

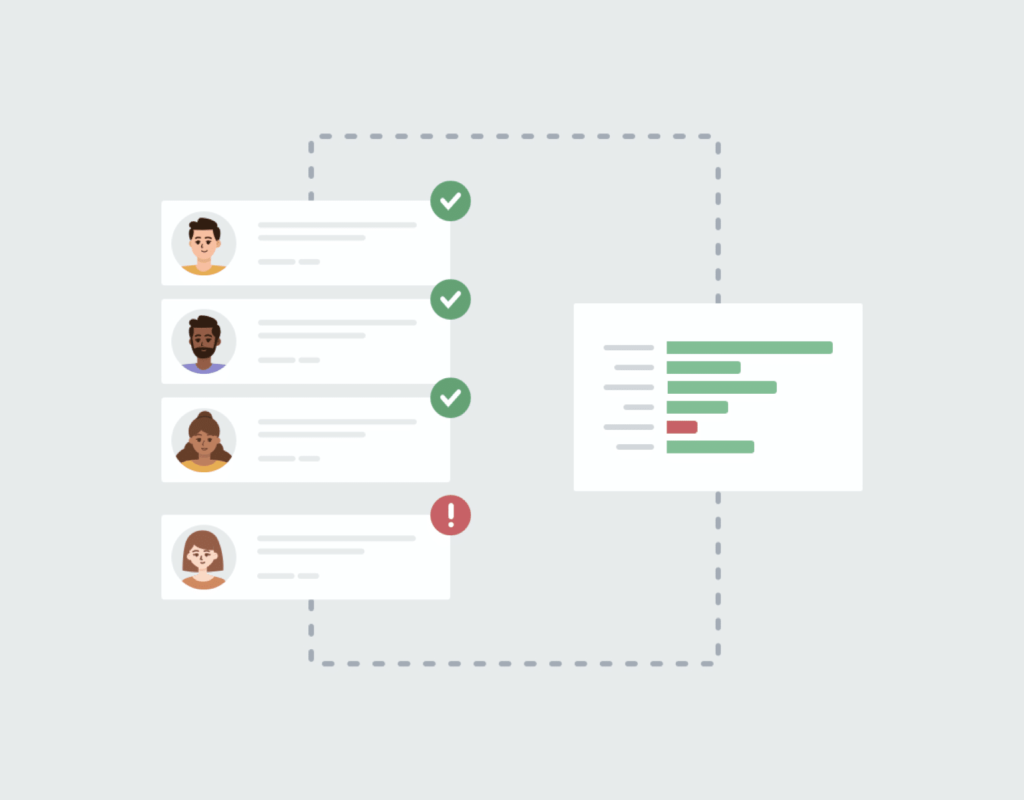
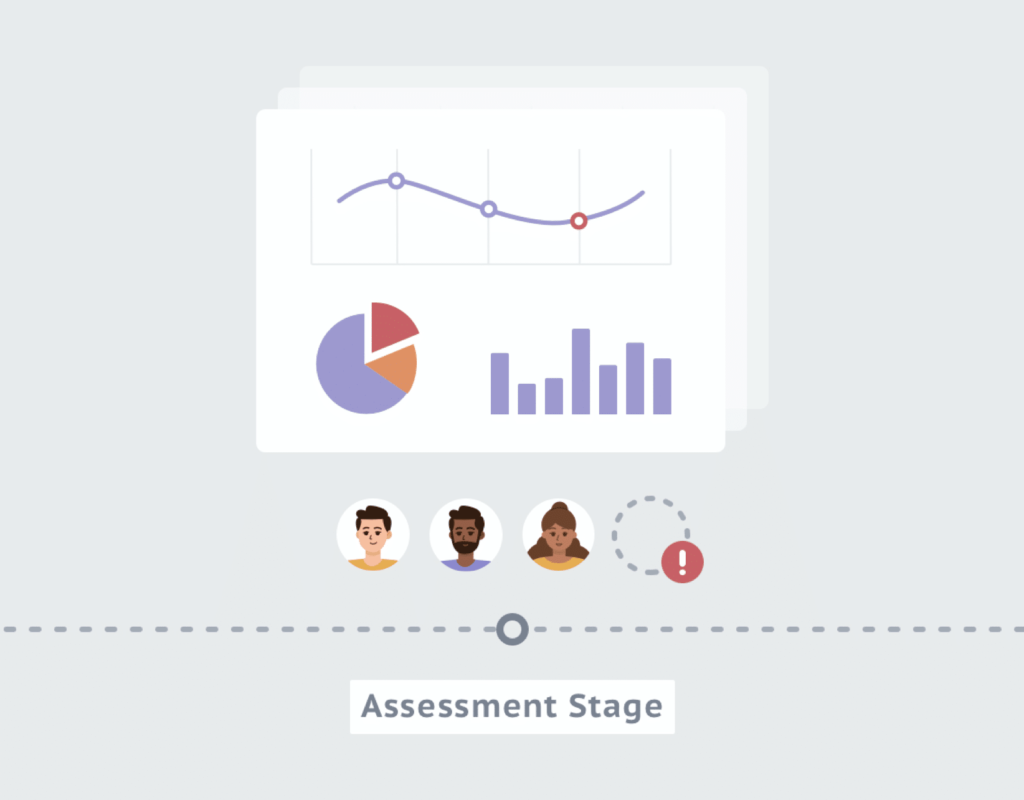
A ground-level view of each job and each step of the hiring process enables your hiring team to address individual issues. You can see not only how many women applied but how many made it through each hiring stage. 

If, for example, women tend to drop out after the interview stage, it’s a sign there’s something (or someone) in the interview stage turning them off. If candidates overall drop out during the assessment stage, it may be time to reevaluate your assessment tests. 

RECRUITING ANALYTICS METRICS / 02

The metrics your hiring team can collect and analyze reliably

Here’s where things get tricky. It’s not enough to gather any old data in any old way if you want valuable insight into your recruiting efforts. How your hiring team goes about data collection and analysis is crucial.

Digital drawing of a recruiting analytics report with a time-to-fill window open.

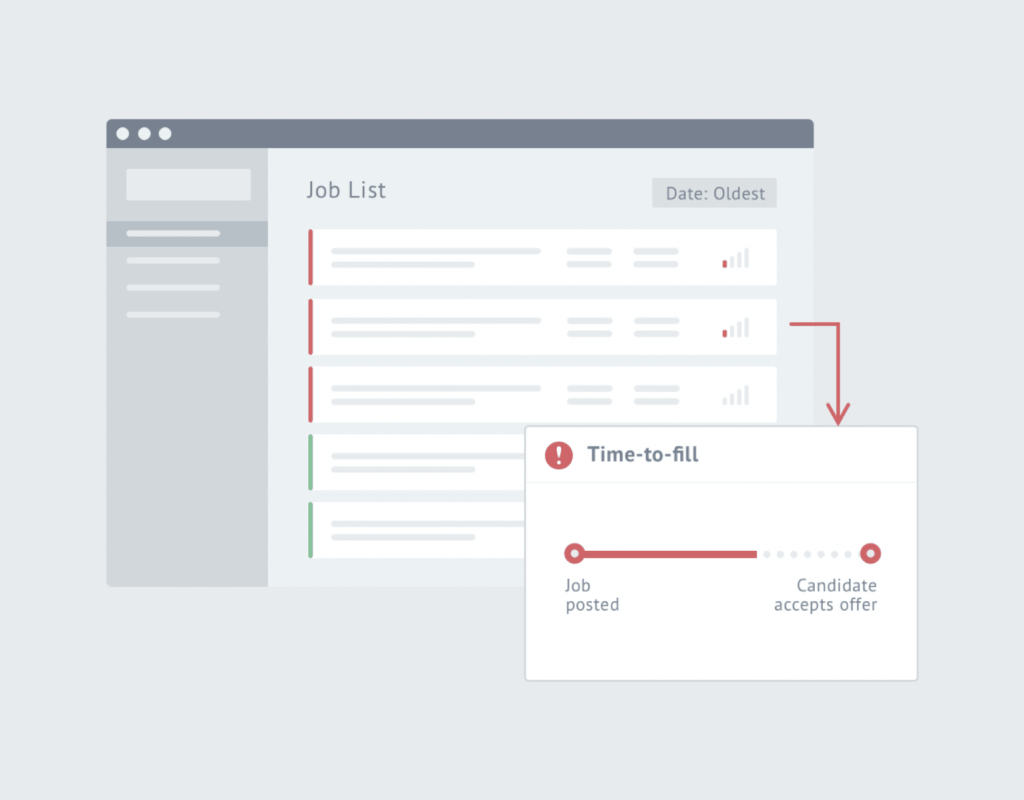
Take the time-to-fill metric. Time-to-fill is big in the recruiting metrics world as a no-brainer that all hiring teams want to collect. Yet time-to-fill isn’t a standard industry measurement and often means different things to different companies.

Also, time-to-fill is impossible to measure when companies keep jobs open. While it may be convenient to keep jobs that the company is always hiring for open, these so-called evergreen jobs wreak havoc on recruiting analytics. They stay open in a company’s applicant tracking system (ATS), making it impossible to gauge time-to-fill because they have no start or end date. Not only that, they skew the overall results if you’re trying to measure time-to-fill across all of your jobs. (More on this in Section 4.)

RECRUITING ANALYTICS PLATFORMS

Platforms To Use in Recruiting Analytics

So, how do you go about doing data science in recruiting? Well, for one thing, your hiring team will need some software.

RECRUITING ANALYTICS PLATFORMS / 01

An ATS

Many (if not most) hiring teams already use an ATS in their hiring processes. In fact, about 98% of Fortune 500 companies use an ATS, according to Jobscan research. They’re fast becoming a must-have for all hiring teams.

With good reason. Applicant tracking systems offer a lot of functionality, and they also help facilitate recruiting analytics. If your hiring team doesn’t use an ATS yet, here’s why you need one.

Recordkeeping

Keeps all applications in one database. Helps with compliance.

Recruiting workflow

Helps organize hiring teams on collaborative tasks (e.g., candidate scorecards). Keeps process moving with notifications to team members on tasks (e.g., interview scheduled, scorecard updated).

Pre-screening

Automated pre-screening of applications. Enables corporations to sift through thousands of applications. Empowers small hiring teams to get through their applications.

User interfaces

So non-IT personnel can use them.

Integration with other platforms

Integration with job boards and social media platforms for automated posting of job ads. Integration with recruitment analytics software (essential for analytics).

Mobile-friendly apply

Crucial to attracting today’s job seekers who use mobile devices for job hunting.

Automated touchpoints with candidates

Automated emails at regular intervals during the hiring process (e.g., post-interview). Maintains contact to help prevent candidate dropouts. 

Assessments

Built-in personality and cognitive ability tests.

Referral management

A way to track candidates referred by employees. 


Here are some of the big names in the ATS world:


RECRUITING ANALYTICS PLATFORMS / 02

A business intelligence platform

Business intelligence, or BI, involves organizing and presenting data so that analysts can…well, analyze it. Typically descriptive, BI focuses on getting and presenting past and current data. Business intelligence platforms collect raw data from multiple databases, organize it, and present it in formats people can understand. 

Your company probably uses a number of different systems, each with its own database (i.e., finance, marketing, human resources). There’s no way to see your entire organization all at once. 

Business intelligence platforms can sit in the middle of these different systems, collating, sorting, and presenting the data so you can access it in one place. They do that through:

Traditional BI systems are complicated enough that analysts have to rely on their IT folks to set up and use the system. Hiring teams typically submit report requests to someone in IT, who then creates a custom report (using SQL queries and custom scripts). The downside to traditional systems is a heavy reliance on IT, while the upside is unlimited customization. (They’re typically better for larger companies with plenty of IT professionals on staff.)

Some of the newer systems on the market are self-service, meaning the average user can do tasks like running reports by themselves. You may need to have your IT department set the system up, but then users are free to fly. There are lots of self-service BI systems on the market now. Here’s a few:

RECRUITING ANALYTICS PLATFORMS / 03

Recruiting analytics software

Analytics involves collecting and analyzing business data. Typically prescriptive, analytics focuses on analyzing past and present data with the goal of informing the future. (A subtle distinction from business intelligence, which focuses more on acquiring and organizing the data.) 

Recruiting analytics software organizes a company’s recruitment data and presents it for use in strategic planning. It’s a business intelligence and analytics platform designed specifically for hiring teams. The software gathers data from any integrated databases and touchpoint systems you use, in particular your ATS. Users can view the data in various dashboards and visualizations, zeroing in on key recruitment metrics. 

Specialized recruitment analytics software is still evolving. However, it should at the very least help you diagnose quality and diversity issues in your talent pipeline. Here are some important functions:

Job performance reporting

A bird’s eye view of total applicants, open jobs, days live, closed jobs, hires made, and more.

Source performance reporting

How inbound candidate sources (e.g., job board, referral) perform in your hiring funnel (i.e., how many candidates applied and how far each went in the hiring process). 

Job description content analysis

Identifies content issues that may diminish your candidate pool (e.g., missing benefits, perks, a diversity and inclusion statement). 

Job description language analysis

An overview of the language you use most in your job posts (via  natural language processing). Highlights language that confuses or dissuades job seekers. 

Open jobs reporting

A snapshot of all open jobs (for recruiting operations personnel).

Pipeline health status

An assessment of each of your job’s inbound funnels. Shows whether a job has a diverse enough candidate pool and sufficient qualified applicants to result in a fair, successful hiring process. 

GETTING STARTED

Getting Started with Recruitment Analytics

In Section 2, we mentioned the importance of methodology when it comes to recruitment analytics. Basically, your approach to data hygiene can mean the difference between garbage or gold. Here are some fundamentals on getting started with recruiting analytics.

GETTING STARTED / 01

Learn (very) basic data management skills

Don’t worry; by very basic, we mean very basic. Using a data management system is something most people can learn fairly easily. You just need to know a couple of things. 

The first thing anyone using a database should understand is that databases don’t make leaps in logic. If two things aren’t exactly the same, the database will assume they’re two separate things. Which means your hiring team will need to establish precise naming conventions for every single type of data point you want to collect and analyze. 

For example, your ATS won’t know that ‘LI’ is shorthand for ‘LinkedIn,’ that ‘HR’ is shorthand for ‘Human Resources,’ or even that ‘St’ is short for ‘Street.’ Your hiring team will need a system for naming every piece of data and will have to stick to that system every time they use the ATS. Otherwise someone will always need to find and combine records (e.g., all the ‘CB,’ ‘Career,’ ‘CBuilder,’ and ‘CareerBuilder’ candidates).

The other thing your hiring team members will need is some familiarity with how to navigate the database. This is basically just how to find, sort, and view records, and how to run and export reports to Excel or other formats. Basic stuff.

GETTING STARTED / 02

Learn the inner workings of your ATS

Not all ATSs operate the same way or have the same functionality. It’s good to have someone who knows the ins and outs of the platform on hand to teach hiring team members. If your ATS has usability issues, like it doesn’t do ‘bulk rejects,’ your recruiters should know that. 


GETTING STARTED / 03

Tweak recruiter incentive structures

Getting clean data may require tweaking the incentive system for your recruiters. Historically, hiring teams have prioritized conversions of candidates through the hiring stages. When a candidate moves to the next stage, that’s good for the recruiter. When they drop out, that’s bad.

Digital drawing of recruiting analytics on a problem at the interview stage of a hiring process.

But this creates a disincentive for recruiters to collect all the data that you need for effective reporting and analysis. If a recruiter offers an interview, they should theoretically move that candidate forward into the interview stage. If the candidate declines the interview, the data should reflect that.

However, recruiters may not advance a candidate in the system until the candidate accepts the interview. So, what actually was a declined interview just looks like a dropout before the interview stage. It’s better to take the pressure off of recruiters altogether by incentivizing clean data.

GETTING STARTED / 04

Collect data on everything, including dropouts

Untainted statistics are more comprehensive statistics. Your team can’t address issues in your hiring process without the full picture. That means collecting accurate, real-time data on everything, including dropouts.

Digital drawing of recruiting analytics on a problem at the assessment stage of the hiring process.

Actually, dropouts are good for data science. If your hiring team is seeing candidates drop out during the assessment stage, it could be time to rethink your assessment tests. Maybe candidates feel like you’re asking too much of them (e.g., an eight-hour unpaid project). If candidates tend to drop out late in the hiring process, it could be that the process is too long, in general. Maybe they’ve accepted another offer in the meantime.

If there’s something causing candidates to drop out of your hiring process, it’s important to identify and rectify it. And the hiring team won’t know it without seeing the data. (Here’s a data cleaning checklist to help.) 

GETTING STARTED / 05

Tie every candidate to a job

In keeping with the clean data theme, it’s important to tie every candidate that comes into your ATS to the specific job for which they apply. And it’s vital to move them through the system in real time. It’s the only way to get a complete picture of how each job performs.

Digital drawing of five candidates, all tied to a single software engineer position.

This is a bit of a wrinkle for hiring teams that like to ‘collect’ candidates in their ATS. Yes, an ATS is a database, but it’s not meant to be a static one; hence, ‘Tracking’ in the acronym. Job seekers on a candidate pipeline or retarget list aren’t moving through your system and, therefore, don’t need tracking. 

Meanwhile, having them in your ATS muddies the water for recruitment analytics. How do you know the number of candidates a job attracted if some candidates aren’t attached to the job? (Remember, your ATS won’t intuitively make the connection between a candidate and a job.) 

GETTING STARTED / 06

Don’t keep jobs open, regardless of hiring frequency

Digital drawing of two jobs left open on a job board for over 100 days and one job open for 20 days.

Again, your hiring team needs the complete picture to know how each job performs. That means every job needs an opening date and a closing date. 

Undoubtedly, recruiting for certain high-volume jobs over and over can be tedious. It’s tempting to keep a job open in your ATS and just make occasional edits without saving it as a new job. But your hiring team can’t get clear metrics from these ‘evergreen jobs.’ Meanwhile, these jobs can skew your overall job data, which is much more important than any one job. 

A few key things that evergreen jobs can’t tell you:

Keep in mind, these positions represent some of your most common recruiting efforts. If anything, you want data on these jobs as much if not more than on your other jobs. But keeping them open makes it impossible to gather the type of data you need to improve them. It also prioritizes convenience in hiring for one position over improved hiring for all positions at your company. 

GETTING STARTED / 07

Collect full pipeline data on every job

This is the inevitable conclusion of all the steps above: collect full pipeline data on every single one of your hiring team’s jobs for clear recruiting analytics

With full pipeline data, your hiring team can identify and address issues at any stage of a job’s hiring process. They can see how many people applied, how many women versus men applied, who made it to the interview stage, who dropped out, who received an offer, and more. They can see trends (e.g., where dropouts occur most frequently). And they can use those trends as a roadmap for improving your hiring processes overall. Always collect full pipeline data.

MEASURING TALENT PIPELINE

Measuring Your Talent Pipeline

The end goal of recruiting analytics is to understand how your organization is attracting talent and to improve on it. A clear picture of your talent pipeline shows you the path of every candidate from every source through every stage of the hiring process. So you can assess sources, identify bottlenecks in your hiring process, and see what’s working or not working overall. 

Measuring your talent pipeline requires some basic understanding of data science (i.e., reporting, analytics). Again, this is basic and doesn’t require you to get another degree. Talent pipeline data is inherently messy, so you need some data cleaning skills. And, of course, you need to know how to accurately measure your talent pipeline. Here are a few fundamentals.

MEASURING TALENT PIPELINE / 01

Use more data, not less

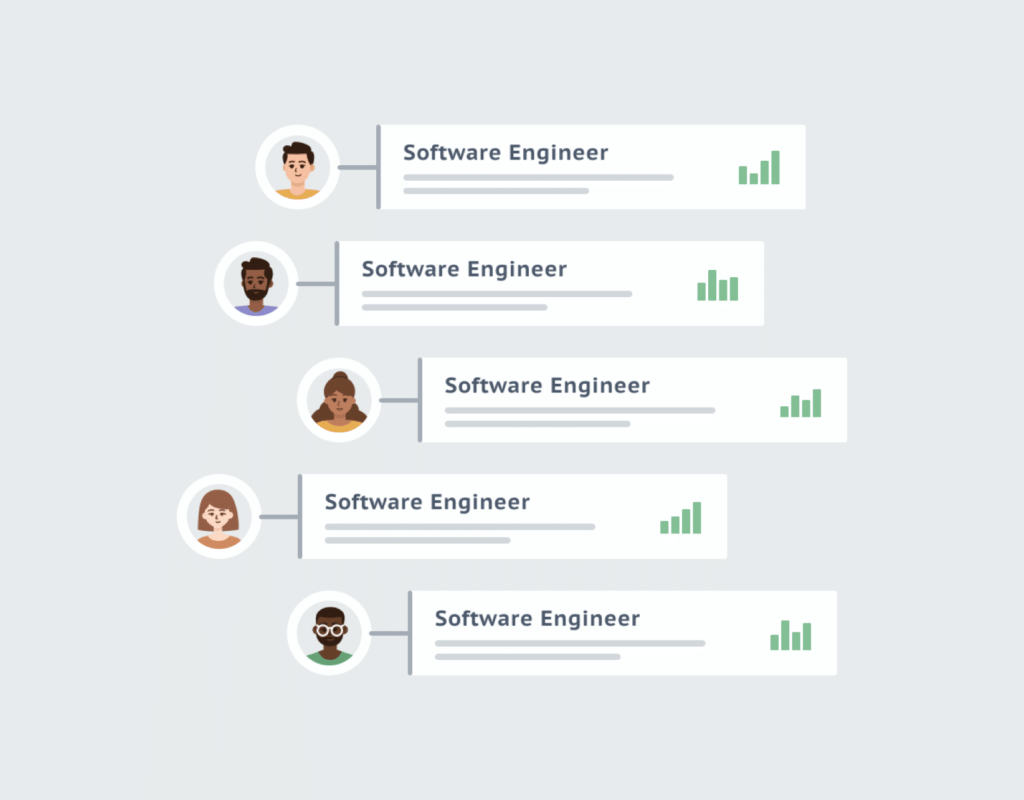
All things being equal, larger data sets tend to be more accurate than smaller ones. Therefore, your hiring team will want to use big enough sample sizes when comparing jobs or other data in your talent pipeline. 

What’s a big enough sample size to provide insight? Companies that do a lot of hiring will find it easy to put together large data sets. However, smaller companies shouldn’t struggle with this, either. Just compare groups of at least 10 or more, as opposed to comparing two jobs against each other. Get into the double digits.

MEASURING TALENT PIPELINE / 02

Don’t include outliers

Outliers are pieces of data that are so outside the norm that they skew the entire picture. It’s like a student who gets a 99 on a difficult exam and wrecks the curve for everyone else. Take that student out, and you get a more accurate view of how the class overall actually did.

Digital drawing of a single outlier altering a data set in recruiting analytics.

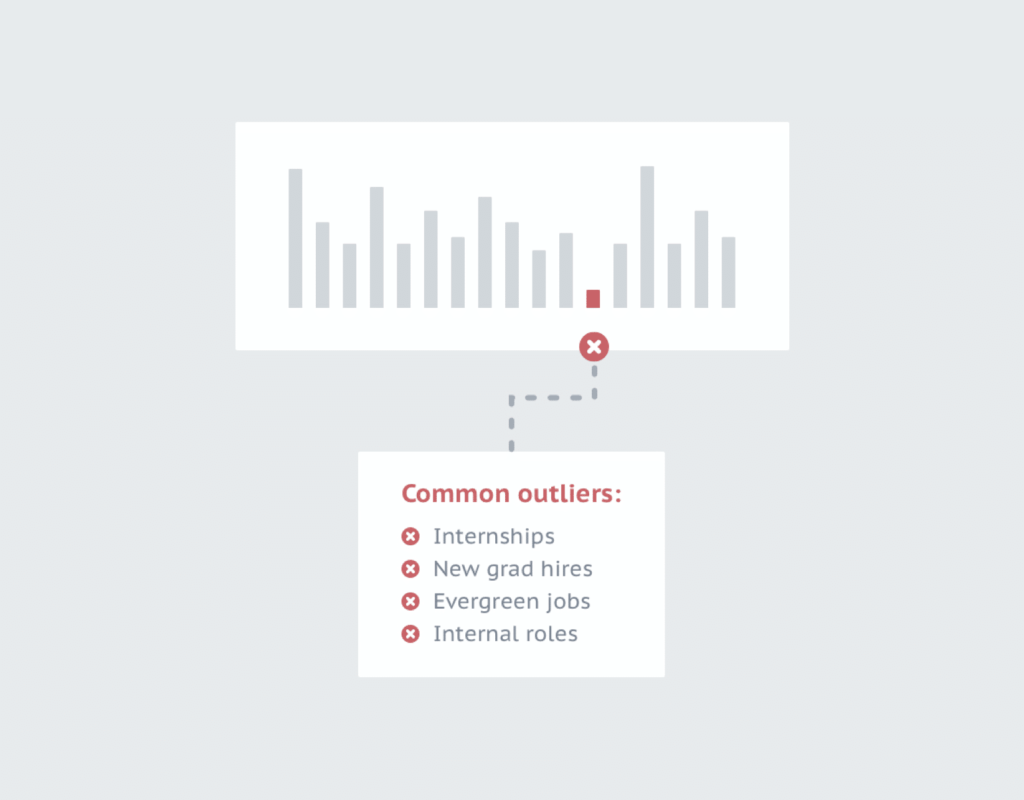
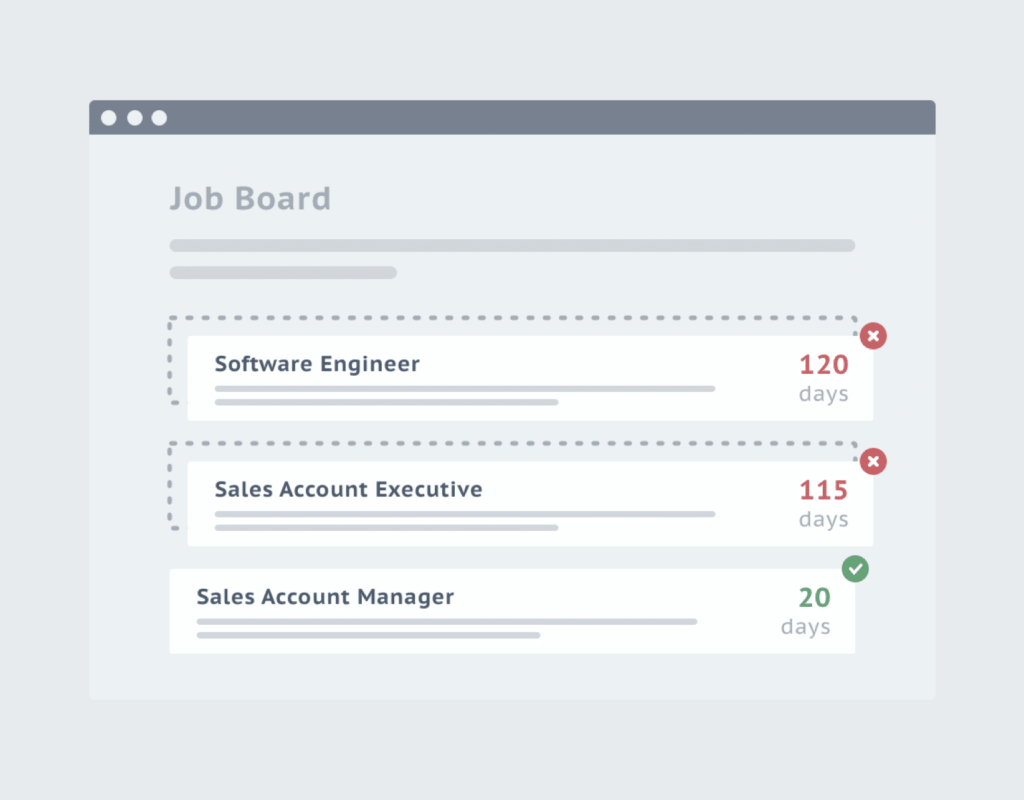
A single outlier can skew data and give you a false impression of your entire talent pipeline. An evergreen job is a good example. This is a job that the company is always hiring for and, so, keeps open. But because it never closes, an evergreen job can dramatically alter a company’s overall time-to-fill data. 

Clean pipeline data requires the removal of outliers like evergreen jobs, internships, new-grad hires, and internal roles. Remove anything that sticks out like a sore thumb and assess the data set that’s left. Also, don’t be surprised if you find multiple outliers; an applicant pool can contain a lot of them.

MEASURING TALENT PIPELINE / 03

Use median calculations

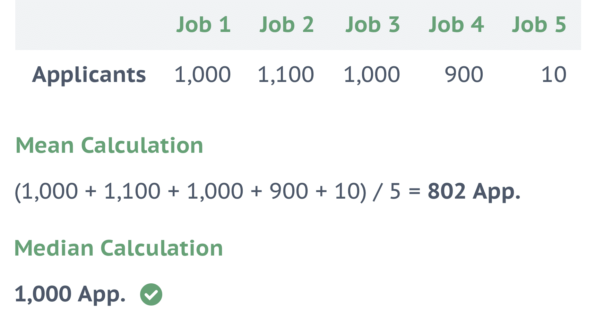
Using the median instead of the average is a good way to bypass outliers. Whereas the average will include outliers in the calculation, the median will exclude them. The median offers a better view of the middle of the road. 

Let’s say you have five open jobs. Four of them have attracted a similar number of applicants, while the fifth has attracted a fraction of the others. The fifth is an outlier (and likely has an issue that’s deterring job seekers). If you include that job in the calculation, it will skew the picture. It’s better to remove it (and immediately reassess the job to identify what issue caused it to attract fewer job seekers). 

MEASURING TALENT PIPELINE / 04

Segment your talent pipeline data

Digital rendering of a recruiting analytics pie chart with more detailed break-out reports on entry-level jobs and senior jobs.

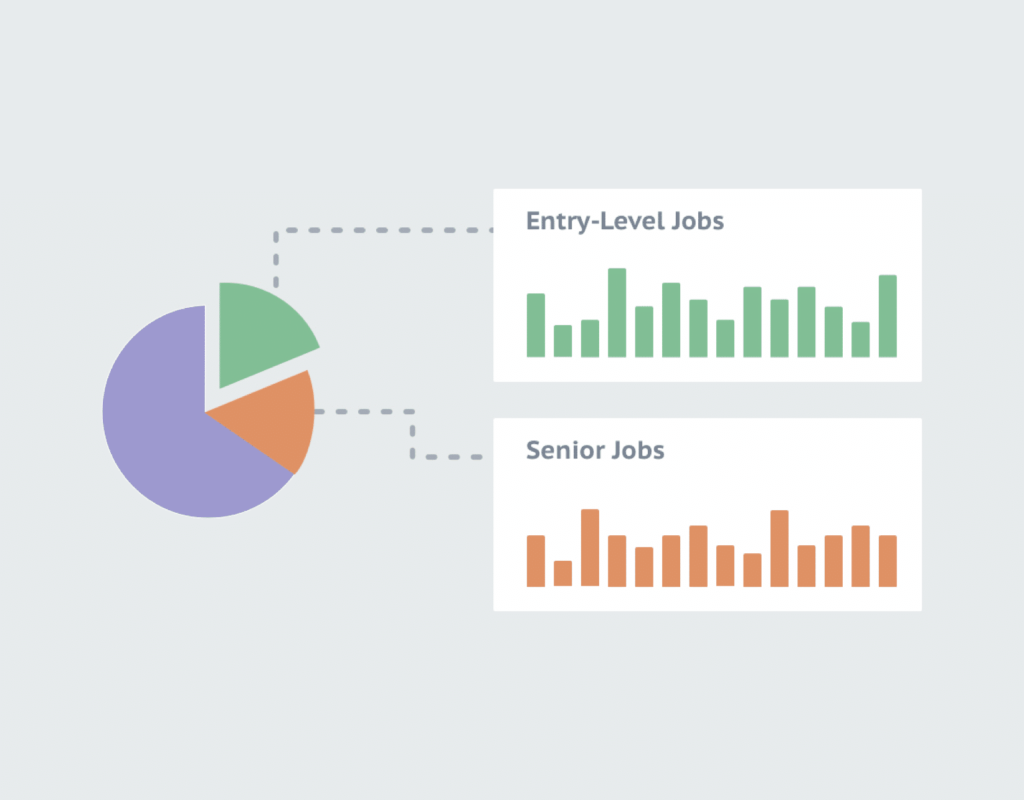
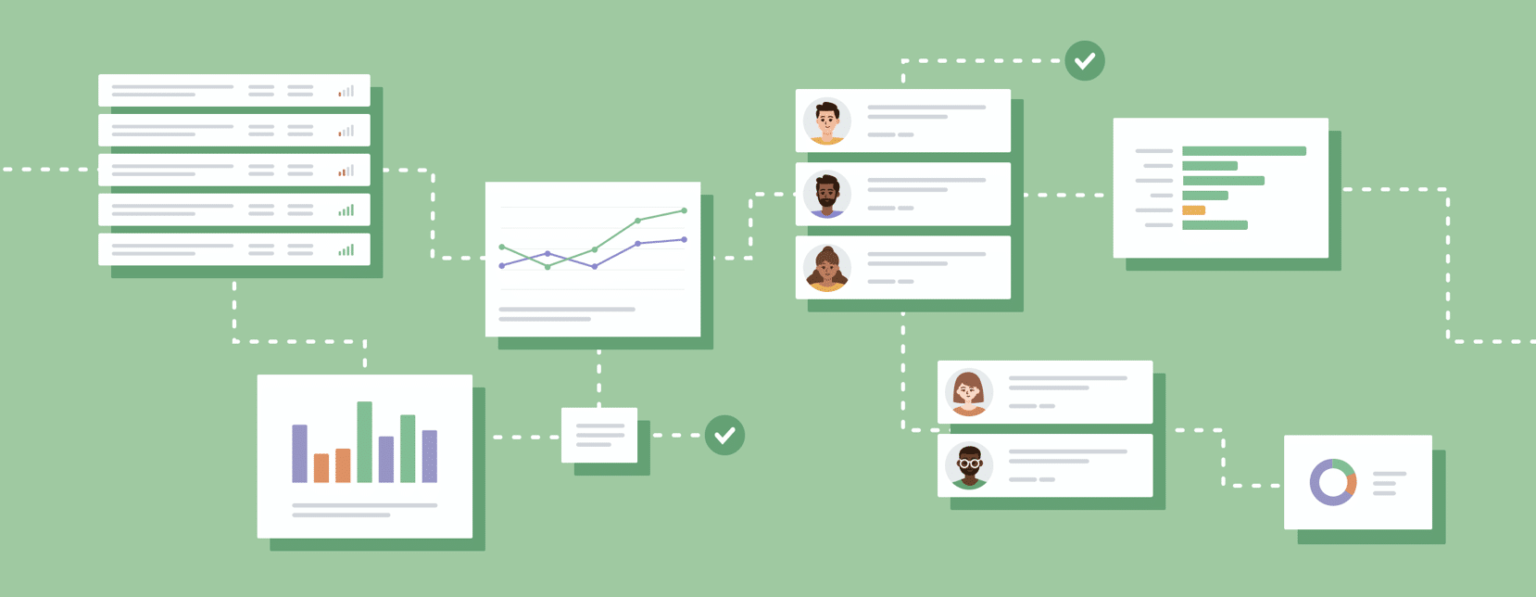
Segmenting, or grouping like with like, can reveal trends in your data that inform and improve your strategic planning sessions. This is where you can get real actionable data.

Hiring for an entry-level role isn’t the same as hiring for the CEO. Recruiting in Sioux Falls isn’t like recruiting in Los Angeles. Finding a great data scientist isn’t as easy as finding a great customer service representative. 

Different variables will naturally require different strategies. Senior jobs may require more thought to fill. Locations with unique job markets may take more time (and a global platform like Datapeople). Some job types are inherently harder to fill than others.

Segmenting your data thoughtfully — by job seniority, location, job type, department, et cetera — highlights any trends. With trends in plain view, you can create strategies that target your organization’s various recruiting challenges and inbound funnels. 

MEASURING TALENT PIPELINE / 05

Ask thoughtful questions

Recruiting analytics can tell you any number of things, but some pieces of data are more valuable than others. That’s why it’s important to ask the right questions when assessing your data.

Digital rendering of the comparison between an old job and a new job discussed in the paragraph beside it.

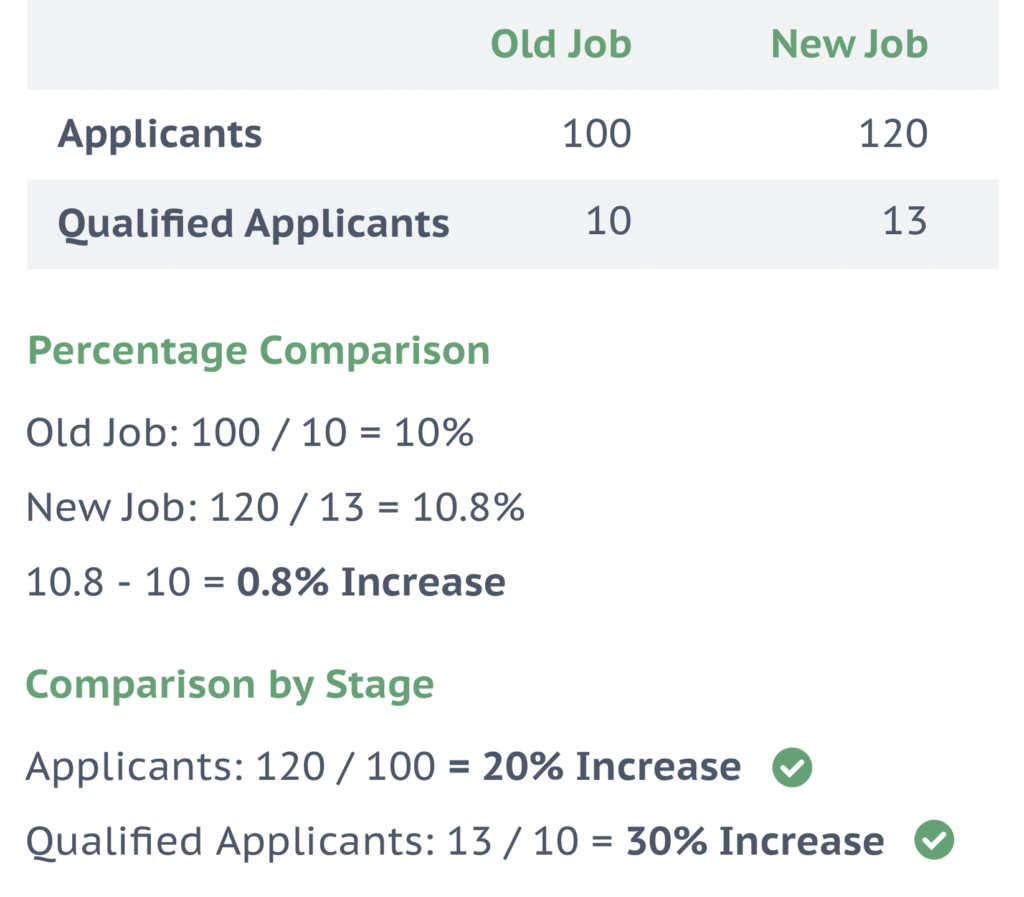
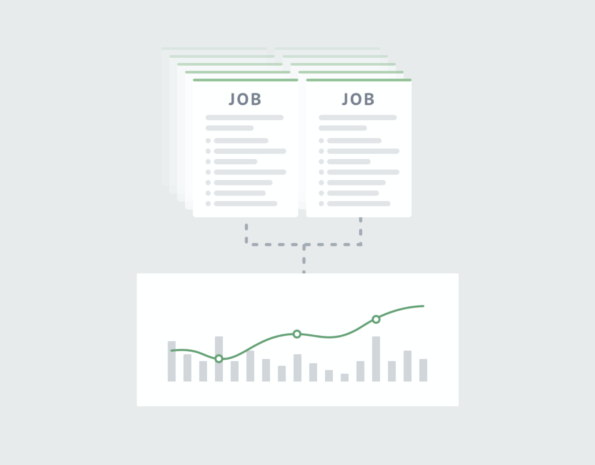
Comparing older jobs to newer jobs can show you how changes to your job descriptions benefit your hiring efforts overall. But it depends on how you’re comparing them. 

Maybe an older job attracted 100 applicants, 10 of whom were qualified. Meanwhile, a newer job attracted 120 applicants, 13 of whom were qualified. Using total applicants as the measure, the newer job wins because it attracted 20 more. Using percentage of qualified applicants to total applicants, the newer job also wins with .8% more. 

But neither of those are the important metric when it comes to recruiting. The important metric is the number of qualified applicants a job receives. The more qualified applicants a job attracts, the more chance of a successful hire. So if you want to compare the two jobs, compare 10 to 13, which is a 30% improvement. 

MEASURING TALENT PIPELINE / 06

Measure the metrics that matter

There are dozens of recruiting metrics that make it onto a talent leader’s weekly dashboard. But in today’s hiring environment, this can be confusing and overwhelming – and ultimately hinder productivity.

Strategically measuring and optimizing the right metrics can mean the difference between a fair, efficient hiring process and failure. But with so many indicators to choose between – from mainstays like offer acceptance rate to newer concepts like ‘pass-through rate by demographic’ – which recruiting metrics should you focus on this year?

We’ve narrowed it down to five key metrics that matter right now, how to measure them, and what benchmarks to apply when validating the performance of your talent acquisition efforts. Download your free copy of The Ultimate Recruiting Metrics Cheat Sheet for 2024 to learn how to calculate, analyze, and improve today’s most important recruiting metrics.