Having a pulse on the current labor market, especially during a tight labor market, is important for setting expectations in the hiring process. Markets can be assessed through multiple lenses, each providing an important view into the economy and having implications for talent teams.
Some of the recent trends include:
- Unemployment rate, one of the most common metrics, was recently reported by the BLS as 3.5% in July 2023 and 3.8% in August 2023, remaining well within the 3-4% range as it has since early 2022.
- Company layoffs have waned significantly compared with January’s high.
- The U.S. Chamber of Commerce recently reported that workforce participation in 2023 is currently sitting at 62.8%, which is an increase compared to the past few years but slightly lower than the previous high of 63.4% in February 2020.
But how can we consider available workers in the context of available jobs?
Datapeople analyzes government data to calculate a job seekers to job vacancies ratio, which represents labor market tightness. When the ratio of job seekers to job vacancies is below 1, it indicates a tight labor market because it means there are more jobs available than people looking for jobs.
Tight labor market by the numbers
For historical context, consider yearly averages since 2005. Although there have been profound spikes in the last two decades (coincident with significant economic events), the ratio of seekers to vacancies in the last two years reflects the most significant labor market tightness in recent memory.
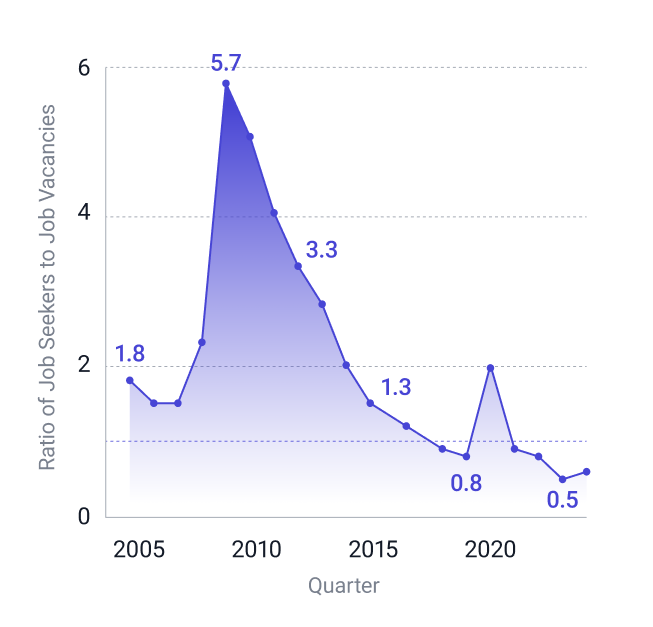
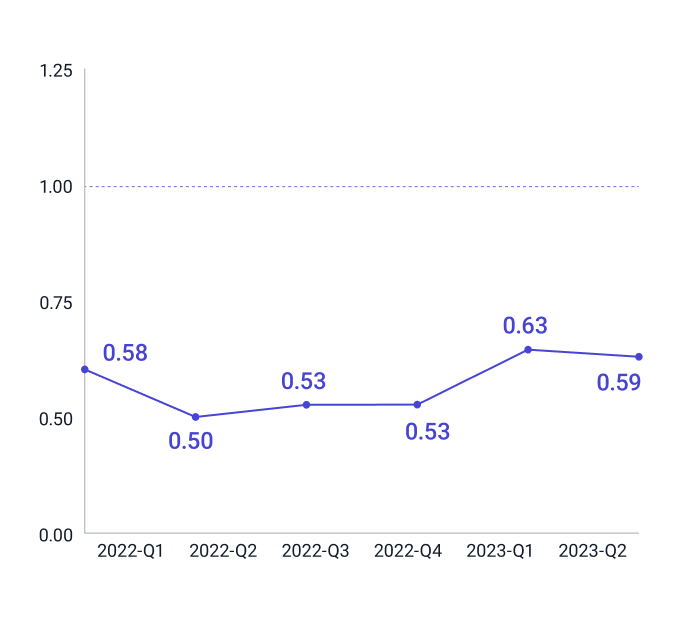
The graph above illustrates the tight labor market of the past couple years. There was a slight relaxation in the first quarter of 2023, but there are still nearly twice as many job vacancies to job seekers.
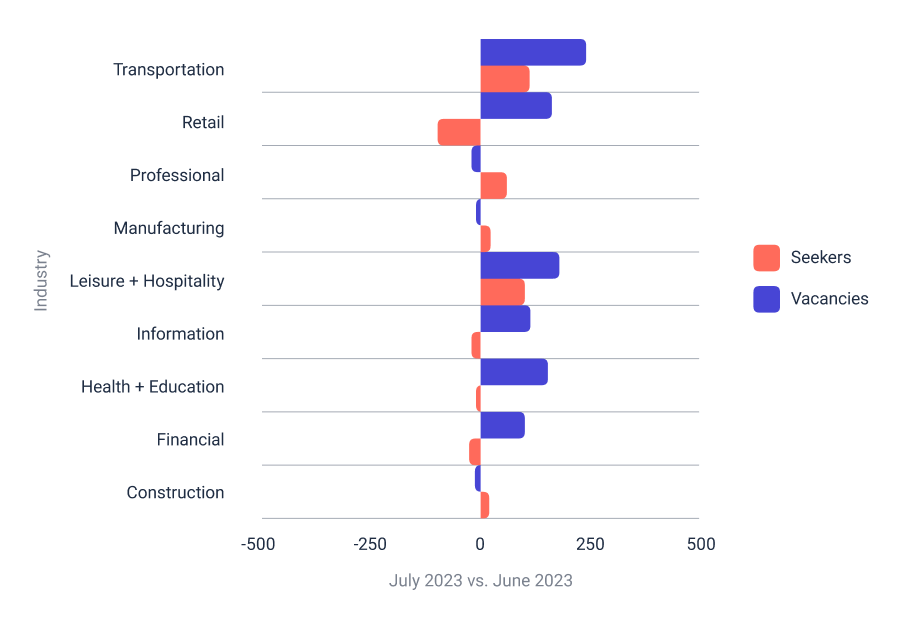
We also see that recent job seeker and vacancy estimates vary by industry over time. When considering the latest month-over-month change in both job seekers and vacancies, we saw that health + education, retail, financial, and information industries had sizable increases in vacancies while also having decreases in job seekers. This is a sustained trend for health + education, which showed the same behavior in our last update.
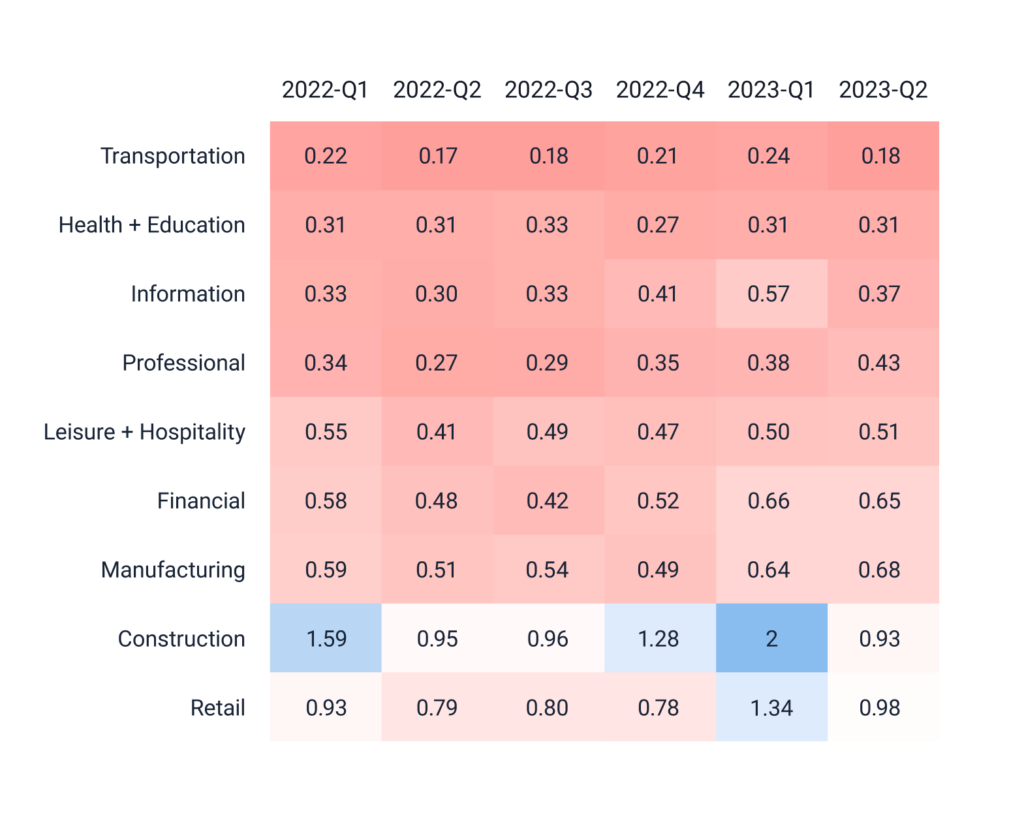
The heat map below illustrates seeker-to-vacancy ratios by industry, where values closer to 1 (an equalized market) are blue and values closer to 0 (a tight market) are red.
Most sectors continue to face a tight labor market. Recently, the information sector observed the steepest decrease in ratio, driven by a drop in job seekers. In our previous report, we noted a trend of labor market slackness in the retail and construction industries. However, the latest data indicates even these industries have tightened. In these roles, there is now approximately one job seeker for each job, while for most other industries there are currently ~2-5 jobs for every seeker.
Keep an eye on the labor market
Although it seemed like 2023 was going to see labor market relaxation, these recent results suggest that we’re seeing more tightness – and we’re seeing it broadly in a number of industries.
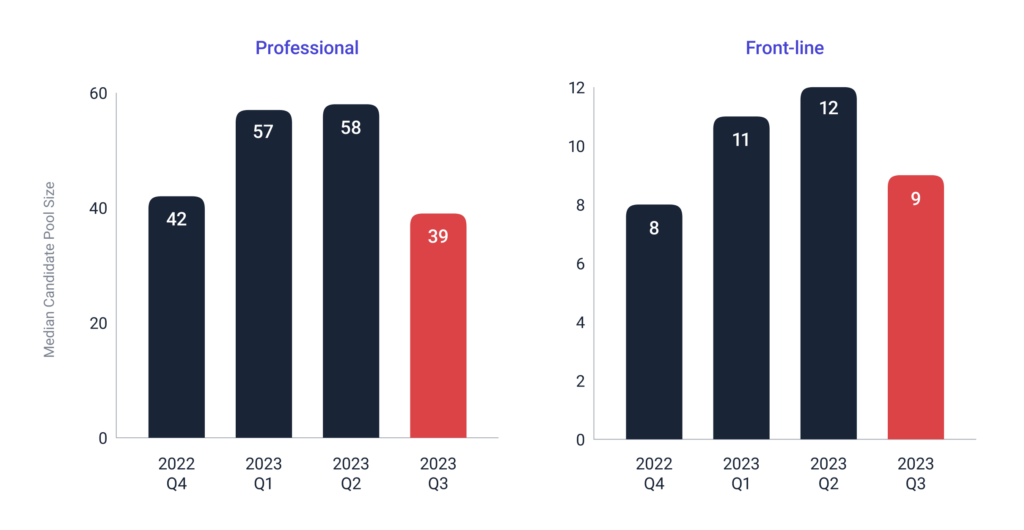
What does this mean for talent acquisition teams? A tight labor market typically means fewer candidates for each requisition. We’ve seen this in our data with the median candidate pool size for both front-line and professional roles declining 30-40% relative to Q2’s highs.
From an operational perspective, a tight labor market means your jobs and the candidate experience you provide must be more attractive. For example, is the compensation market-calibrated (and included right in the job post)? Are there perks or other incentives that would put you ahead of competing employers?. It is also important to consider whether your hiring process can be streamlined (e.g., fewer, faster interview rounds) to mitigate the risk of candidates accepting other offers before you make a decision.
From a strategic perspective, a tight labor market correlates with lower offer acceptance rates and higher candidate drop-offs. In a relaxed labor market, an offer acceptance of 80% might have been reasonable, but in a tight labor market it may be closer to 70%. Talent teams should reconsider benchmarks or how you measure your team’s performance.
