Data science is beginning to transform the recruiting industry like it has so many others. One way it’s doing that is by enabling you to more accurately understand your talent pipeline.
But strategic decisions based on analytics are only as good as the underlying data (i.e., you need clear recruiting analytics) and methodologies (e.g., how you measure time-to-fill). Here are five steps for cleaning up your data and accurately measuring your talent pipeline.
Not every office has the same recruiting challenges or the same inbound funnel. They may need different strategies. To understand the opportunities and challenges your various teams are facing, segment your talent pipeline data thoughtfully.
Organize by Location
Big-city jobs attract more applicants than small-town jobs. And different types of offices recruit different types of candidates in altogether different industries.
Recruiting strategies that work in New York (population 8.6 million) may not work in Ithaca (population 31,000), even though they’re in the same state. Strategies for a customer-support office may not work for an engineering office.
Segmenting your talent pipeline data by location is one way to get a clear view of what your recruiting teams are facing on the ground. If you segment by location (e.g., New York versus Ithaca, East Coast versus West Coast), you avoid overly broad or blended comparisons.
Organize by Seniority
Junior-level jobs bring in more applicants than senior-level jobs. As you go up the ladder, positions are therefore inherently harder to fill.
A job description for a software engineering internship will look nothing like a job description for a Software Architect position. The strategy for attracting those candidates will look very different too.
By segmenting your talent pipeline by seniority, you can see how well you’re attracting interns, recent college graduates, mid-level professionals, and management. And you can tailor your recruiting strategies to each accordingly.
Organize by Job Type
Recruiting for a warehouse job isn’t the same as recruiting for a finance job. Meanwhile, it’s easier to find a sales candidate than it is to find an engineering candidate.
Each industry and each job within that industry has its unique challenges for recruiters. By segmenting them out, you can optimize recruiting strategies for every area, from shipping to finance to sales to engineering.
2. Remove known talent pipeline outliers
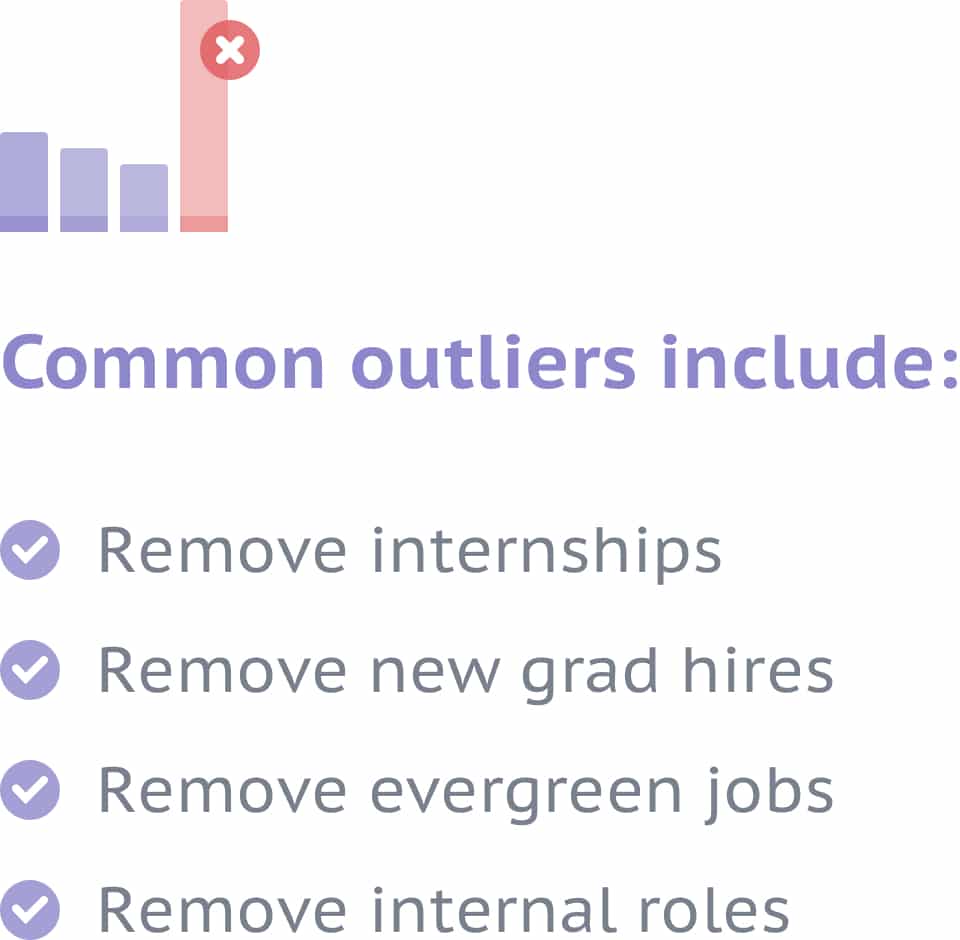
Not all jobs behave the same. And even a single outlier can skew your talent pipeline data and give you an inaccurate impression of your talent pipeline.
Removing jobs that regularly perform outside of expected ranges helps clean up your talent pipeline data. Some common examples include internships, internal roles, new-grad hires, and evergreen jobs. (Evergreen jobs are the listings you never take down because you’re always hiring for them.)
3. Use enough data from your talent pipeline
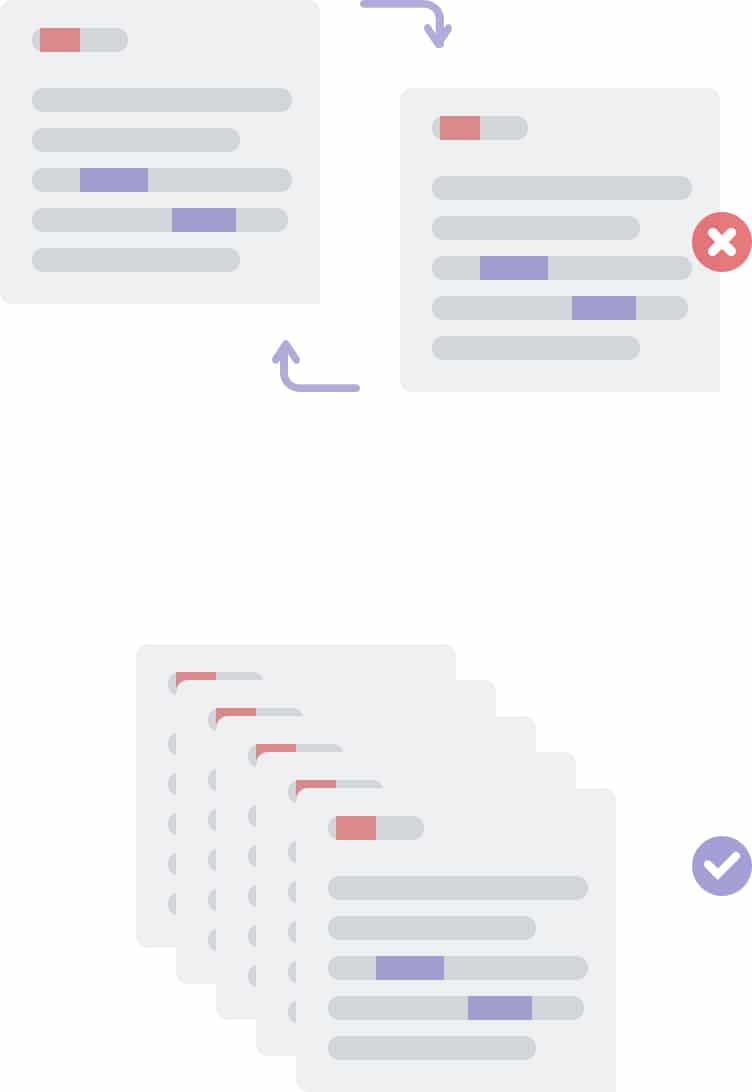
Comparing two individual jobs may be interesting, but it doesn’t tell you a whole lot. You need a minimum amount of data to get analytics that you can take positive action on.
Small job groups don’t give you much insight into your talent pipeline. Meanwhile, they’re too easily skewed by marketing efforts, holiday schedules or even changes to job-board search algorithms.
It’s best to avoid comparing individual jobs or single-digit groups of jobs against each other. Instead, break your comparison groups into 10 or more jobs so you’re in the double digits on both sides of any comparison.
4. Use median calculations
When it comes to means (the average) versus medians (the middle value), medians are your friends. One extreme outlier can throw an entire mean calculation off. Therefore, the only way to get an accurate result is to use median calculations instead.
Again, even a single outlier can skew your talent pipeline analytics and take you down the wrong strategic path. And applicant pool data can contain lots of extreme outliers.
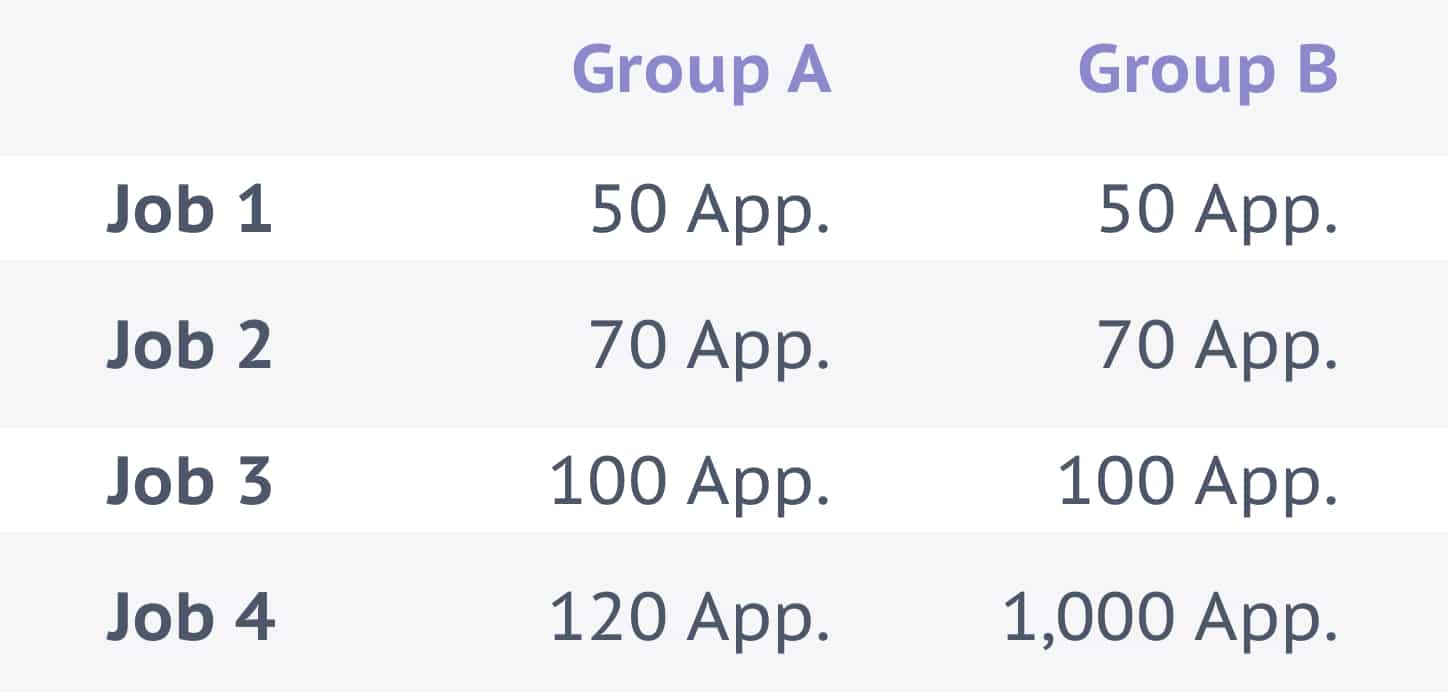
In this example, Job 4 in Group B is an outlier. If you calculate the mean of both groups, you will get the false impression that the jobs in group B tend to attract more applicants. You’ll want to instead calculate the median number of applicants for both groups to get an accurate result.
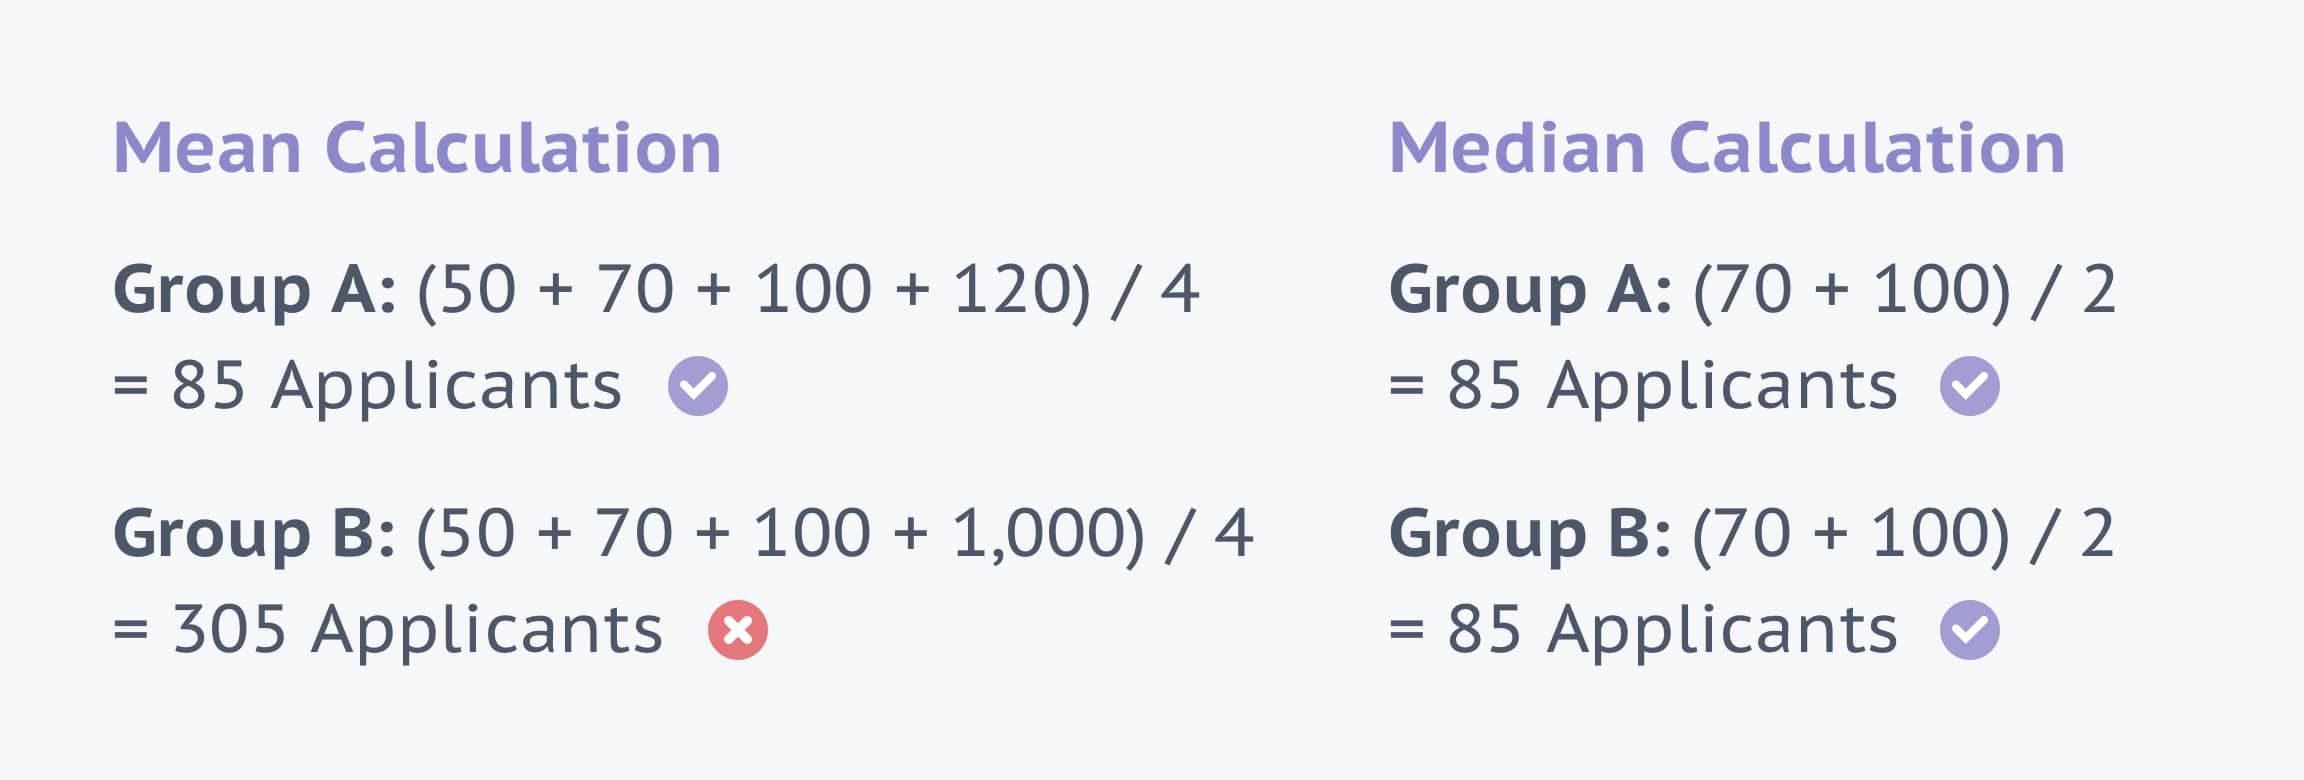
Result
The median calculation shows that Group A and Group B both typically attract about the same number of candidates.
5. Ask the right questions
Benchmarking new jobs against older jobs can show you the evolution of your job descriptions. It can also help you define your talent pipeline strategy going forward. But only if you’re asking the right questions while you do it.

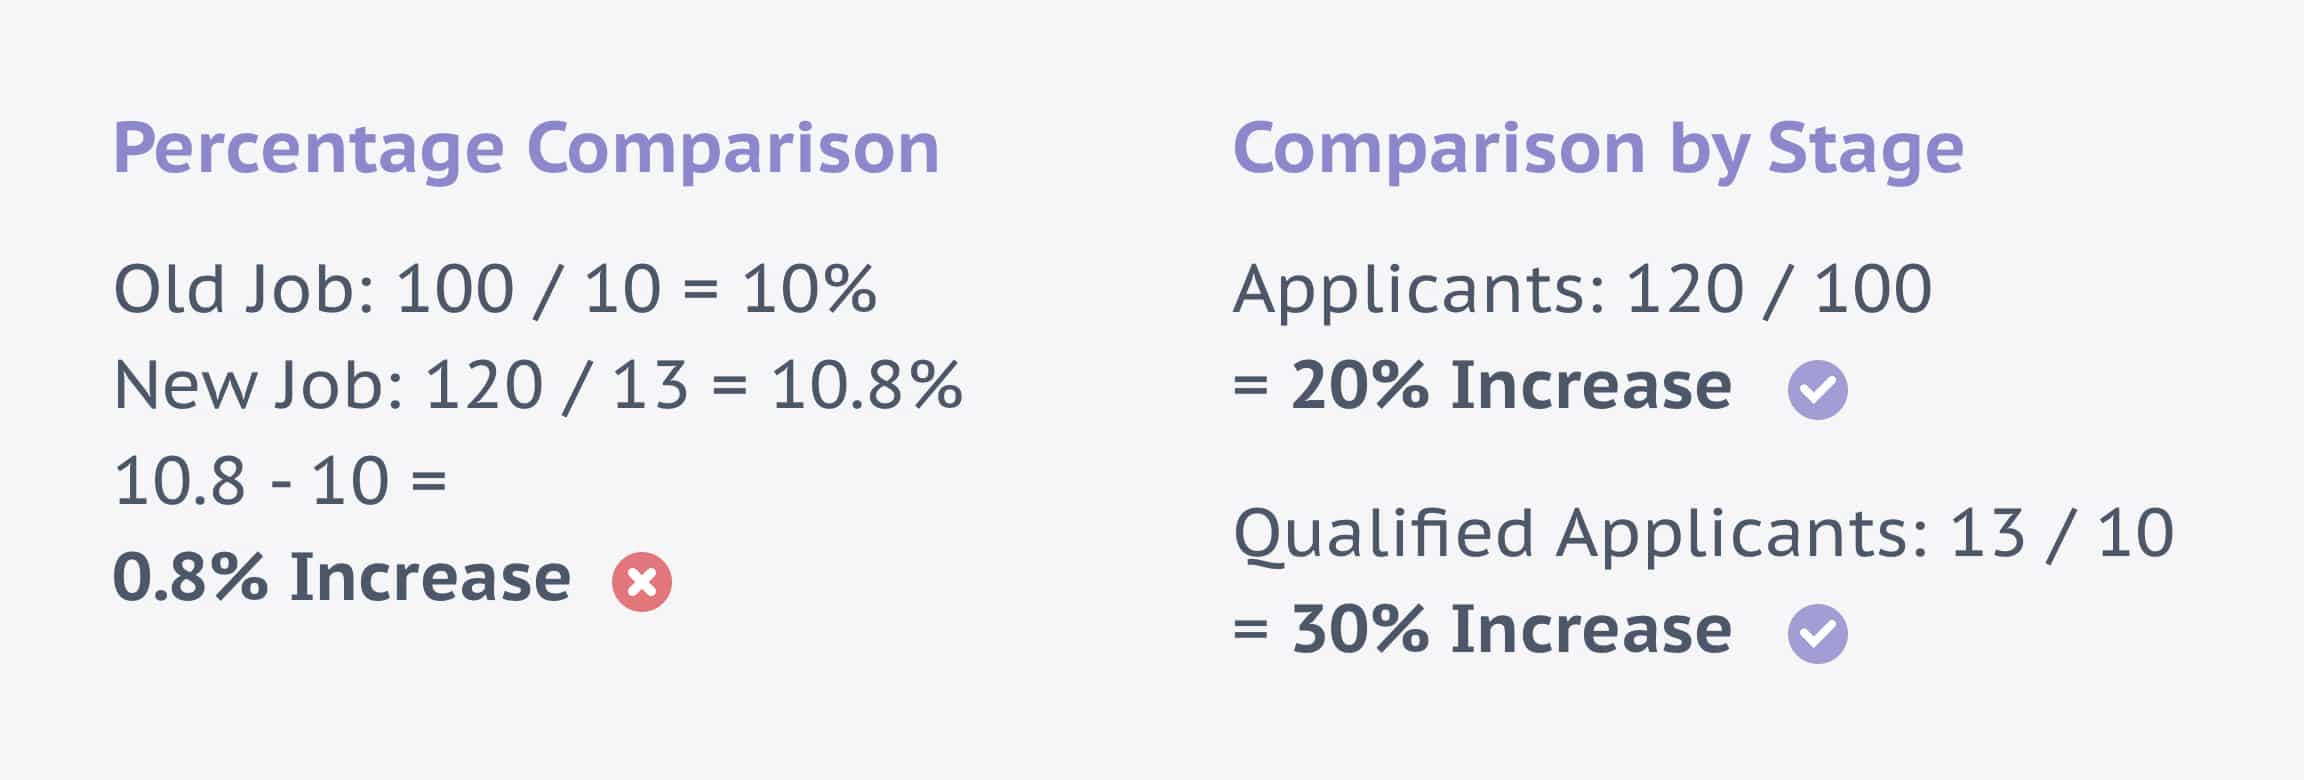
It’s tempting to look at the percentage of qualified candidates versus unqualified candidates for different jobs. You might compare a job that received 10 qualified applicants out of 100 to another that received 13 out of 120. From 10/100 to 13/120 is a .8% increase. But that’s not the important metric.
The more qualified candidates a job gets, the more likely the job is to fill. So the important metric is the number of qualified candidates, not the percentage of qualified to unqualified candidates. Comparing those numbers (10 to 13), you see a 30% increase in performance from the old job to the new one. That’s a more accurate takeaway from the data.
Result
The New Job attracts 20% more applicants and 30% more qualified applicants versus the Old Job.
How to measure your talent pipeline
The strategic decisions you make based on data science are only as good as your underlying data and the methodologies used to support them. Therefore, remember to segment your talent pipeline data, remove known outliers, and incorporate enough data. Also, use median rather than mean calculations, and always ask the right questions.
Skewed data leads to skewed analytics which leads to wonky strategic decisions. But by taking a few steps to clean things up, you’ll be able to correctly measure your talent pipeline and come away with valuable, actionable insights.
